Stakeholders have asked for an update of the WC Medical Share of Losses, originally shared during
Annual Insights Symposium (AIS) 2024 and
AIS 2025. In this inaugural edition of Asked & Answered, NCCI is providing the latest available values and offering insight into what factors may affect this ratio.
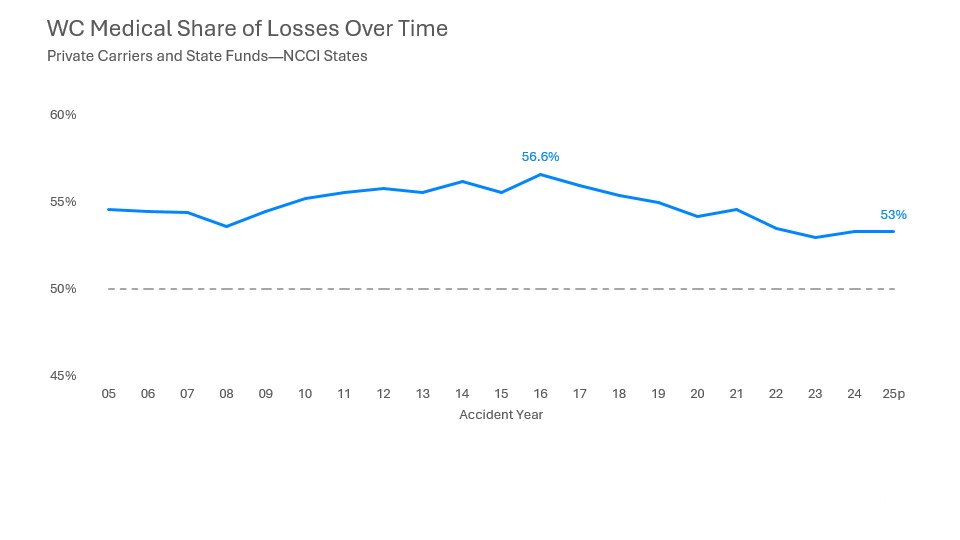
The preliminary medical share for AY 2025 remains 53%, which is unchanged from AY 2024. In fact, at a high level, the metric generally appears flat over at least the last two decades.
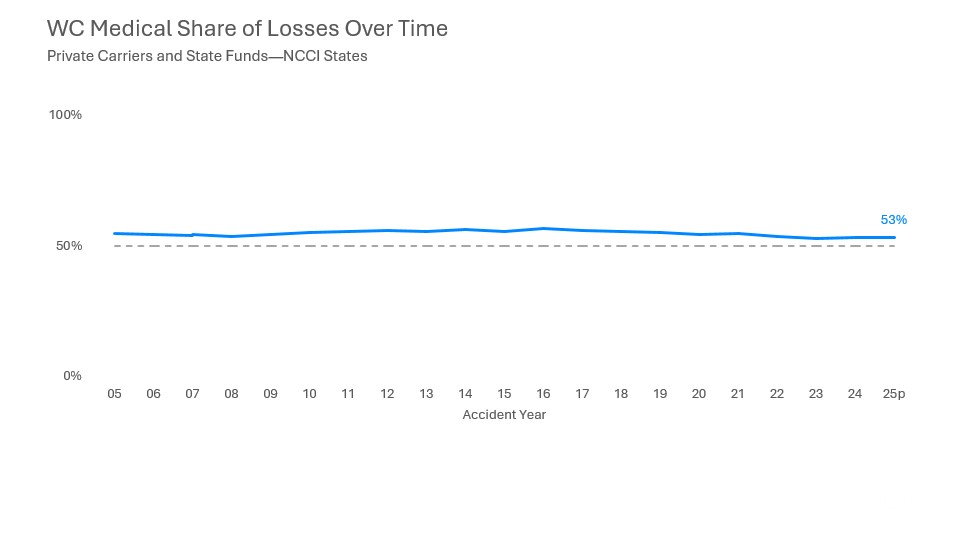
By zooming in and adjusting the scale, however, more variation in the share can be observed. Specifically, the medical share has declined from its peak of 56.6% in AY 2016.
What’s Causing This Decline?
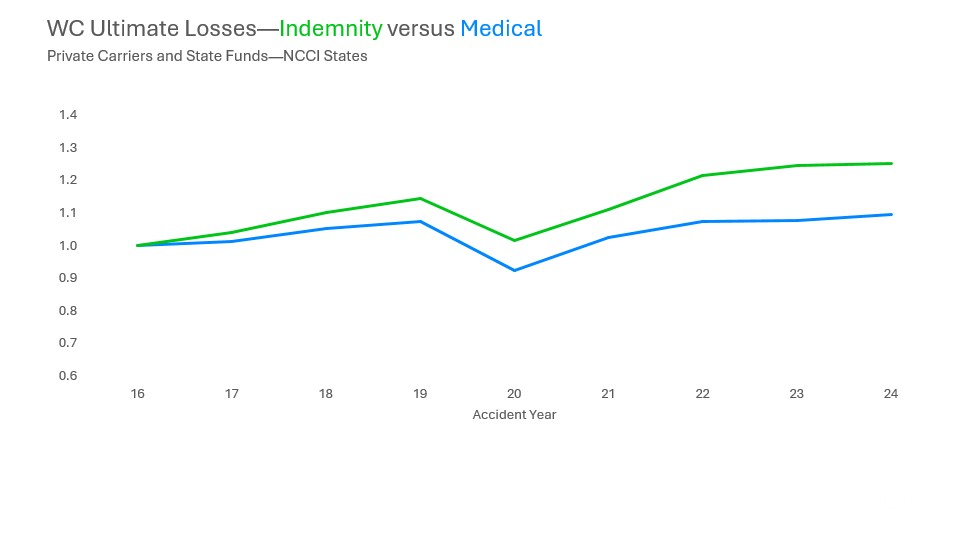
The answer is in the underlying medical and indemnity losses. When we index the ultimate losses to 2016, the widening gap between the blue and green lines below shows that indemnity losses are growing at a faster rate than medical losses. This is consistent with our measures that show that wages have outpaced medical inflation in recent years.1 Looking ahead, projections for wage growth from the US Bureau of Labor Statistics and projections for medical price growth from Centers for Medicare & Medicaid Services suggest this pattern will continue.
What About 2026?
The estimate for Accident Year 2026 is still developing. However, if wages continue to grow faster than medical prices, the medical share of losses could remain similar as AYs 2024–2025 or even potentially decrease.
The Big Picture
For all NCCI states combined, most costs each year stem from medical benefits. On the surface, the medical share of losses seems generally consistent over time. However, a deeper look reveals indemnity losses have been growing more quickly than medical losses in the most recent accident years.
Click here to download a table of the medical loss shares. The medical loss shares are expressed in percentages. The source of the data is NCCI’s Financial Call data, developed to ultimate, excluding large-deductible policies; it is based on data through 12/31/2024 and excludes COVID-19 claims through 7/1/2023. Values displayed reflect the methodology underlying the most recent rate/loss cost filing as of
AIS 2026. The data includes all states where NCCI provides ratemaking services; TX is excluded through 2010 and WV is excluded through 2014. 2025p is preliminary and based on data valued as of 12/31/2025.
NCCI values our stakeholders’ inquiries and feedback, and we have multiple avenues available to connect with us.

This article is provided solely as a reference tool to be used for informational purposes only. The information in this article shall not be construed or interpreted as providing legal or any other advice. Use of this article for any purpose other than as set forth herein is strictly prohibited.