KEY TAKEAWAYS
- National employment growth in nonagricultural sectors is projected to be 1.7% in 2017, slightly down from 1.9% in 2016.
- National wages in nonagricultural sectors are projected to grow by 1.9% in 2017, almost double the 1.0% growth rate in 2016.
- Most economic sectors that experienced above-average wage or employment growth in 2016 are projected to do so again in 2017, and vice versa. A notable exception is Natural Resources and Mining, where employment rebounded in 2017 after falling in previous years.
- Sector mix varies considerably among US states, often with discernible regional patterns.
- Interstate differences in employment and wage growth are not significantly determined by varying state mixes of slow- and fast-growing economic sectors. Rather, states where employment and wages are growing faster than the national average tend to exhibit higher-than-average growth in
all sectors, irrespective of sector mix.
EMPLOYMENT AND WAGE GROWTH BY STATE AND ECONOMIC SECTOR
This edition of the
Quarterly Economics Briefing reviews changes in wages and employment in the United States by state and by major economic sector over the past two years. The first section examines employment shares for major economic sectors by state and identifies key economic sectors that contribute particularly high shares of employment in each state compared to the national average. The following sections discuss projected employment and wage growth by state and sector for 2017 in comparison with 2016. Since final 2017 data are not available, data figures and tables use projected employment and wage growth from Moody’s Analytics for 2017.
In some states and regions, employment and wages are growing much faster than in others. What drives these differences?
- Do states with higher employment or wage growth have more concentrated shares of fast-growing economic sectors?
- Are fast-growing states growing faster across the board, independently of their sector mix?
We find that sector mix explains very little of interstate variation in employment and wage growth. Instead, the second proposition is substantially correct: states with faster employment and wage growth are growing faster than the national average across
all economic sectors. Intuitively speaking, state effects are more important than sector mix in explaining variations in employment and wage growth.
EMPLOYMENT SHARES BY STATE AND SECTOR
Table 1 shows the percentage of private employment in each economic sector by state and for the United States. The District of Columbia is listed first and then the 50 states are ordered from largest to smallest by total employment. Nationally, more than half of private employees work in the three largest sectors: Trade, Transportation, and Utilities; Education and Health Services; and Professional and Business Services. In addition, the Leisure and Hospitality sector and the Manufacturing sector each account for 10% or more of the US employment.
Collectively, the other five sectors comprise only 20% of the US workforce, but each of them has a high concentration in a few states. Note, for example, Wyoming’s 9.6% employment share in Natural Resources and Mining, and Delaware’s 12.2% employment share in Financial Activities. This matters because sector-specific shocks have an outsize effect on employment and wages in states with high sector concentrations.
WHAT ARE EACH STATE’S KEY SECTORS?
We define a key economic sector for a given state to be one in which the state’s employment share exceeds the national employment share by two percentage points, or is 50% greater than the national employment share. Key sectors are highlighted in blue in Table 1. The first criterion characterizes key sectors as those that employ the most workers in a state compared to the size of the sector if all states had the same workforce composition. The second criterion recognizes that for sectors that are nationally small, for example Natural Resources and Mining with a 0.6% national employment share, a large state deviation of 50% or more could be much less than two percentage points. A small change in an absolute number of workers in a small sector may be more important to state economies than an equivalent increase in employment in a large sector, which would not materially change the state’s concentration in that sector.
Here are some examples of key sectors.
Minnesota’s two key sectors are Education and Health Services as well as Manufacturing. In 2017, Minnesota is projected to employ 541,000 Education and Health Services workers, comprising 21.5% of total private employment in the state, and 320,000 Manufacturing workers, a further 12.7% of private employment. The national shares for those sectors are 18.6% and 10.0%, respectively. Minnesota’s employment shares in the two sectors are 2.9 and 2.7 percentage points higher than the national average, meeting the first criterion of a key sector.
California’s key sector is Information. California is projected to employ 528,000 Information workers, representing 3.7% of its private workforce. This is 216,000 more workers than would be expected if its share matched the national average of 2.2%, a 69% increase. These 216,000 workers over an expected total of just 312,000 are enough to qualify it as a key sector, although it is only 1.5 percentage points higher than its expectation.
Figure 1 shows the full set of key sectors. The map demonstrates clear regional differences in the distribution of US employment. The most obvious takeaways are the importance of Manufacturing in much of the South and Midwest, Education and Health Services in the Northeast, and Natural Resources and Mining in the Southwest and Rocky Mountain states.
The maps also show relationships between sectors in several states. Nine of 12 states with a key economic sector in Trade, Transportation, and Utilities also have a key sector in either Natural Resources and Mining or in Manufacturing. Three of four states with a key sector in Construction also have a key sector in Natural Resources and Mining. Delving into sector employment more deeply, Trade, Transportation, and Utilities’ high employment shares in Wyoming, Montana, North and South Dakota are all related directly or indirectly to transportation needs. All four states have above-average employment in both truck transportation and gasoline stations. These jobs are largely related to resource extraction as raw materials are moved. This further illustrates the importance of Natural Resources and Mining, as production from one key sector creates jobs in others.
Key service sectors tend to be more geographically scattered (except Education and Health Services), but many states’ key sectors make intuitive sense. Professional and Business Services is a key sector in the District of Columbia, Maryland, and Virginia, capturing the concentration of consulting, law, and other professional work around the nation’s capital. California and Washington’s tech jobs lead to a key sector in Information. Tourism drives the Leisure and Hospitality key sector in Hawaii, Nevada, and Florida.
Other key sectors are perhaps more surprising, but upon inspection, they reveal regional hubs for certain industries. For instance, Arizona’s key sector in Financial Activities is less obvious than New York’s, but it is a regional center for banking and financial operations—Wells Fargo, JP Morgan Chase, Bank of America, and American Express are all among the state’s 20 largest employers. Colorado has a high concentration in computer systems design and architectural and engineering services, leading to its key sector in Professional and Business Services.
Taken together, key sectors give a sense of how employment patterns change across states and regions.
EMPLOYMENT GROWTH BY STATE AND SECTOR
Figures 2 and 3 show employment growth by state for 2016 and 2017. Growth in a particular year is defined as change from average employment in the previous year to average employment in the listed year. Nationally, employment grew by 1.9% in 2016, slightly higher than the 1.7% growth currently projected for 2017.
Green indicates employment growth, while red indicates employment decline. Darker colors indicate faster growth or decline. In both years, employment tended to grow faster in the South and West and more slowly in the Northeast and Midwest. Nevada, Utah, Florida, Georgia, Oregon, Idaho, and Washington were among the top 10 states in employment growth in both years.
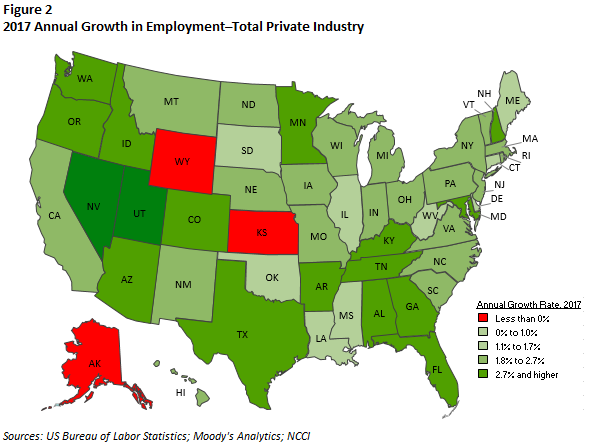
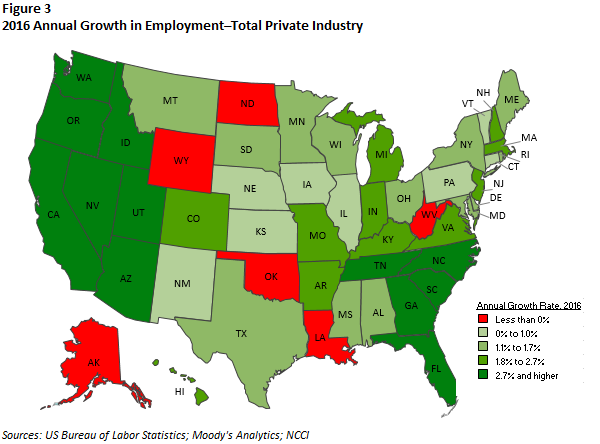
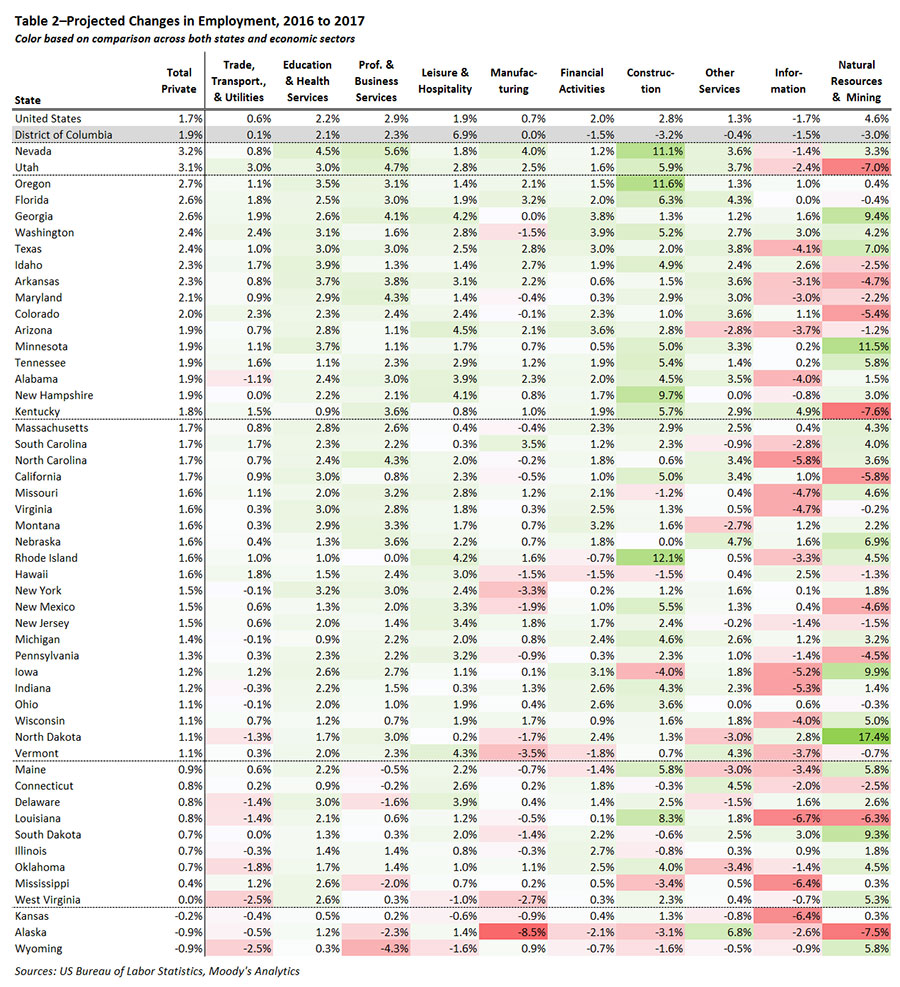
Table 2 shows national and state employment growth by sector. In both years, actual or projected employment in Professional and Business Services, Construction, Education and Health Services, Leisure and Hospitality, and Financial Activities grew faster than overall employment growth. Employment in Trade, Transportation, and Utilities; Manufacturing; Information; and Other Services grew more slowly in both years. In fact, projected employment in 2017 in the Information sector
declined. The final sector, Natural Resources and Mining, is small but very volatile. It lost one-sixth of its total employment from 2015 to 2016, but is projected to grow 4.6% in 2017. This would gain back only about a quarter of the jobs from the previous year, but makes for the fastest employment growth of any sector in 2017.
Construction is projected to have the fastest two-year growth of any sector, as it was the fastest-growing sector of 2016 and the third-fastest growing sector in 2017. One interesting difference between the two years is the growth in residential versus nonresidential construction employment. According to the Associated Builders and Contractors’ breakdown of Bureau of Labor Statistics data, employment for Residential Building and Residential Specialty Trade Contractors increased 5.0% throughout 2016, whereas the corresponding nonresidential categories increased only 1.5%. This year, residential and nonresidential construction employment grew more similarly: 3.2% and 2.8%, respectively. The construction sector’s overall employment growth rate was similar in the two years, but the growth in the two kinds of construction were very different.
An obvious question arising from the discussion of employment by state and sector is: How much of a state’s employment growth can be explained by its sector mix? Do states that have more workers in fast-growing sectors such as Professional and Business Services or Education and Health Services grow faster than those with more workers in slow-growing sectors such as Trade, Transportation, and Utilities or Manufacturing? Or are states with high employment growth simply growing faster across the board?
We find that almost all the variation between states is driven by the latter. States with high employment growth tend to see high growth within sectors, especially in the largest sectors. Our analysis is for all states and sectors, but for an illustration, consider only the three largest sectors. Of the top 10 states in employment growth rate:
- All 10 are projected to have faster-than-average growth within the Trade, Transportation, and Utilities sector
- All 10 are projected to grow faster than average in Education and Health Services
- Eight are projected to grow faster than average in Professional and Business Services
For the bottom 10 states in employment growth rate:
- One is projected to grow faster than average in Trade, Transportation, and Utilities
- Three are projected to grow faster than average in Education and Health Services
- None are projected to grow faster than average in Professional and Business Services
High employment growth overall is reflected in high employment growth in each sector.
What about sector mix? Table 1 and Figure 1 show that there is regional variation in sector mix, and Figures 2 and 3 show there is also regional variation in employment growth. It could be that states with faster employment growth have a lot of employment in fast-growing sectors as well as growing faster within sectors, but this is not what we found. Sector mix is a very weak predictor of statewide employment growth for two reasons.
- The sector mix is not sufficiently different across states to explain most variation in employment growth. States’ predicted employment growth, based solely on sector mix, would typically differ from the national average of 1.7% by one-tenth or two-tenths of a percentage point.
- In over half of the cases, the predicted difference from sector mix is in the wrong direction, meaning sector mix predicts above-average growth, but the state experienced below-average growth or vice versa. In other words, states with a lot of employment in faster-growing sectors do not have higher employment growth overall.
With no significant impact from sector mix, employment growth is almost completely driven by state effects.
WAGES BY STATE AND SECTOR
A full review of labor market conditions must consider not only total employment but also wages for workers across the United States. Figures 4 and 5 show growth in average weekly wages by state for 2017 and 2016.
It is apparent from the additional dark green in the 2017 map, indicating faster wage growth, that most states are projected to have stronger wage growth in 2017 than in 2016. Wages are projected to increase in every state except Connecticut and Alaska in 2017. In 2016, 10 states are in red, indicating wage losses. Wages are projected to grow by an average of 1.9% overall in the United States in 2017,1 as opposed to 1.0% in 2016.
Average weekly wage growth is more volatile than employment growth between years by sector. Employment growth in 9 out of 10 sectors was either faster than average or slower than average in both 2016 and 2017, with the only exception being Natural Resources and Mining. For wage growth, 7 of the 10 sectors are on the same side of average.
- Leisure and Hospitality, Information, and Other Services experienced faster-than-average wage growth in 2016 and project to do so again in 2017
- Professional and Business Services, Manufacturing, Natural Resources and Mining, and Financial Activities have slower-than-average wage growth in both years (or wage declines, in the case of Natural Resources and Mining)
- Trade, Transportation, and Utilities; Education and Health Services, and Construction had wage growth above the national average in one year and below average in the other
The projected wage changes by sector and by state and sector are shown in Table 3. Like employment growth, state wage growth is driven almost entirely by faster or slower wage growth within each sector. Finally, states’ employment and wage growth does not depend on having what would appear to be a favorable employment mix for economic growth.